Live Chat
Need Help?
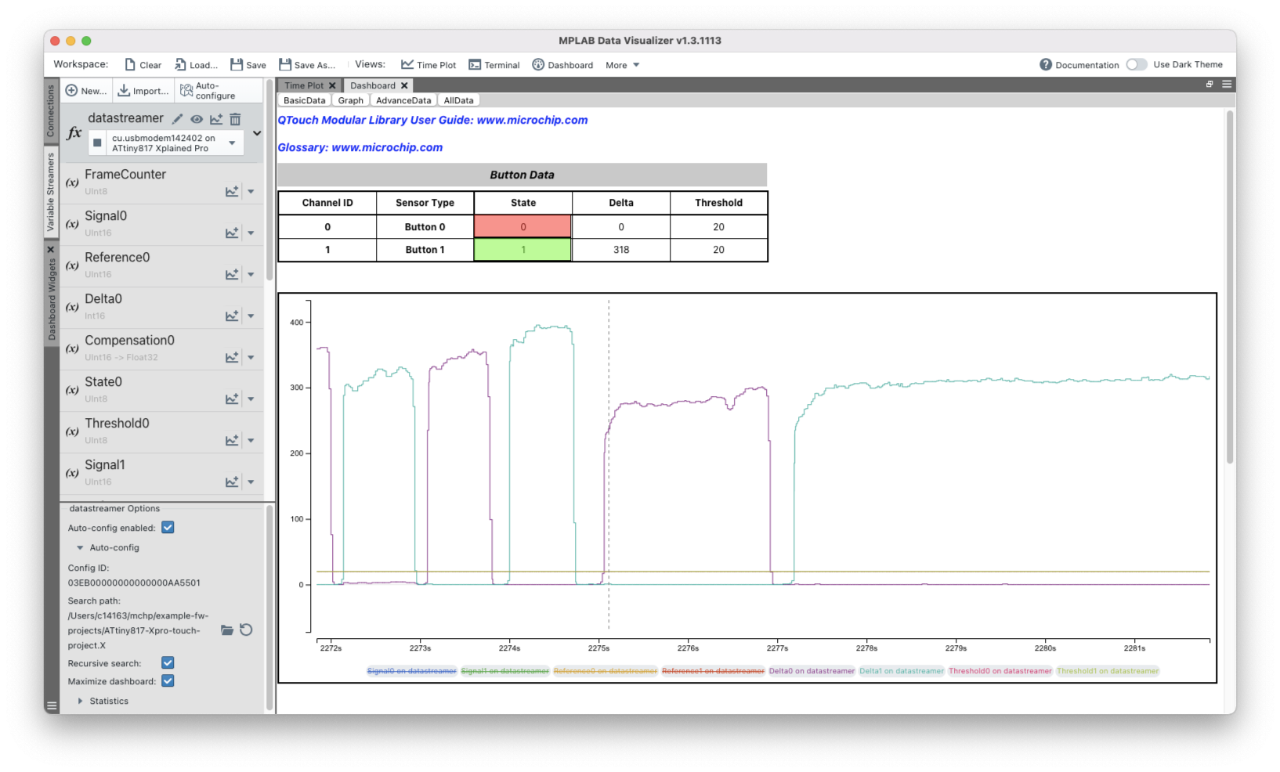
Privacy PolicyTroubleshooting your code's run-time behavior has never been easier. MPLAB® Data Visualizer is a free debugging tool that graphically displays run-time variables in an embedded application. Available as a plug-in for MPLAB X Integrated Development Environment (IDE) or a stand-alone debugging tool, it can receive data from various sources such as the Embedded Debugger Data Gateway Interface (DGI) and COM ports. You can also track your application's run-time behavior using a terminal or graph. To get started with visualizing data, check out the Curiosity Nano Development Platform and Xplained Pro Evaluation Kits.
Key Features
MPLAB Data Visualizer v1.4.1926 Released
This release of MPLAB Data Visualizer includes many updates and improvements. Some of these enhancements include:
- Additional basic scope functions to better visualize fast-changing data
- Updated data logging features to save time stamps as integers with selectable resolution and allow for better compression of long-running data capture files
- Improved DVRT, with support for batch reading and writing
- Improved data source settings and voltage output controls for supported kits and tools
- An improved DGI polling approach, which reduces the likelihood of buffer overruns on busy PCs
- Improved resilience when parsing ELF/DWARF in general
For a complete list of features in this release, please read the release notes.
Downloads and Documentation
Need Some Help?
We are here to support you. Contact our Client Success Team to get assistance with your design.

Using the MPLAB® Data Visualizer
In this video, learn about:
- Plotting debug GPIO
- Kit detection
- Plot all pins: add new plot, assign source
- Using cursors to measure a time between two cursors
