Although redesigning an FPGA design can be straightforward, some engineering work is involved. Seeing is believing—you can judge the potential power gains on your own design and with your own device.
The power comparison below displays temperature data for our power estimator and a power estimator from one of our competitors. This comparison is typically done within minutes and involves no specific FPGA know-how. Architectural differences between different FPGA types are accounted for.
Compare the Power Consumption of Our FPGAs to Competing FPGAs
Power Consumption Versus Ambient Temperature of a Microchip FPGA

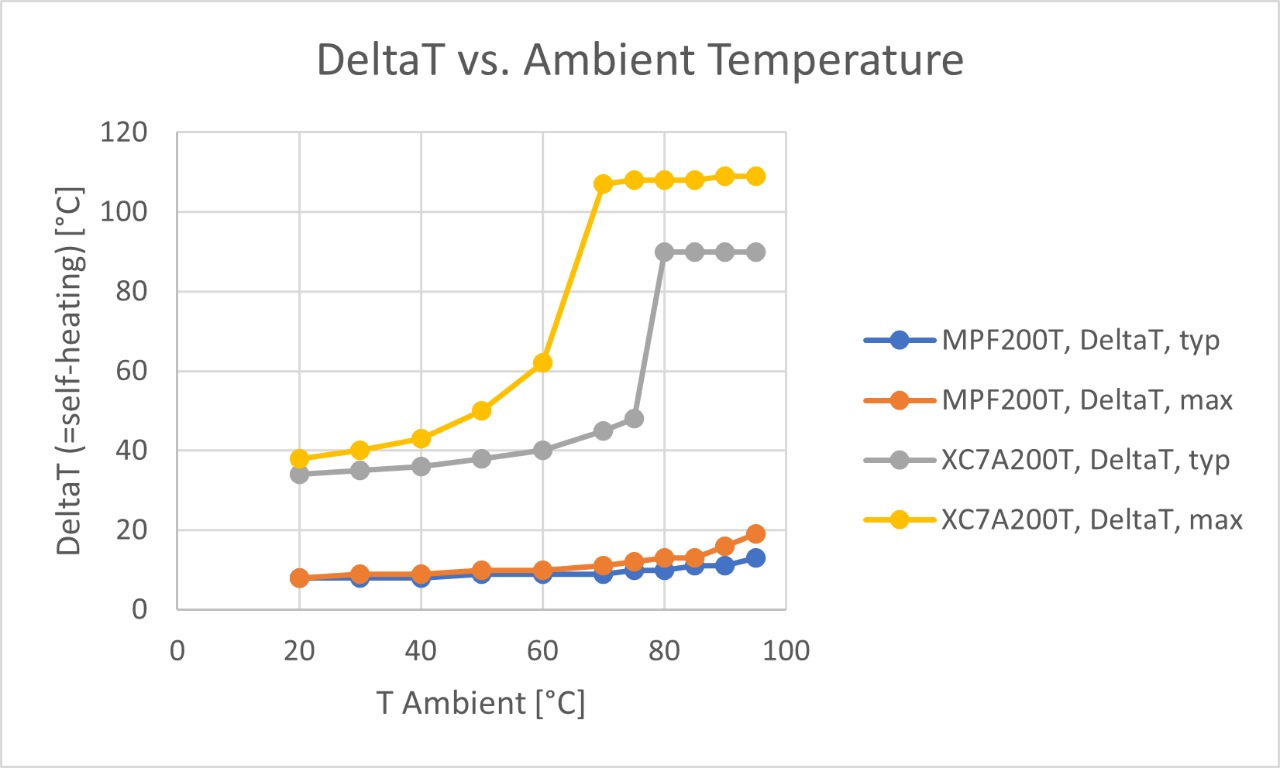
DeltaT Versus Ambient Temperature of a Microchip FPGA
Power Consumption Versus Ambient Temperature of a Competing FPGA

DeltaT Versus Ambient Temperature of a Competing FPGA
Using the Power Comparator
To use the power comparator, download the Xilinx Power Estimator (XPE), the Microchip Power Estimator (MPE) and the power comparator.
The comparison between the devices is based on an XML export from the design tool, typically Vivado, in the form of an .xpe file.
This .xpe file contains the information on the utilization of the FPGA resources and the toggle rate of these resources. Based on this information, the tools can model power consumption based on the provided environment conditions on a board. This information contains the thermal conductivity between the device and the environment and the ambient temperature.
We provide the details on how to use the power comparator in the user guide with the utility itself and an example .xpe for a Xilinx® Artix®-7 device.
Follow the steps below to run the comparison:
- Open XPE, MPE and the power comparator. All three files must be open and loaded into Excel for correct operation.
- Import the *.xpe file into XPE.
- Adjust the settings on file names of XPE and MPE and the sweeping modes in the power comparator on the tab “Transfer”; see the user guide for details.
- Click the button “Transfer XPE to MPE”. => This translates from XPE into MPE.
- Select the correct PolarFire® FPGA device to compare against the competitor’s device. You should select a similar devices with similar utilization of device resources.
- After successful transfer, click the button “Create Power Comparison”. The power comparator sweeps through the ambient temperature for typical and worst-case devices on both architectures and records the resulting power consumption and junction temperature. Based on the resulting data, a new tab is created to visualize the power and temperature behavior in the form of comparative charts on power consumption, self-heating of devices and absolute junction temperature.

Interpreting the Results
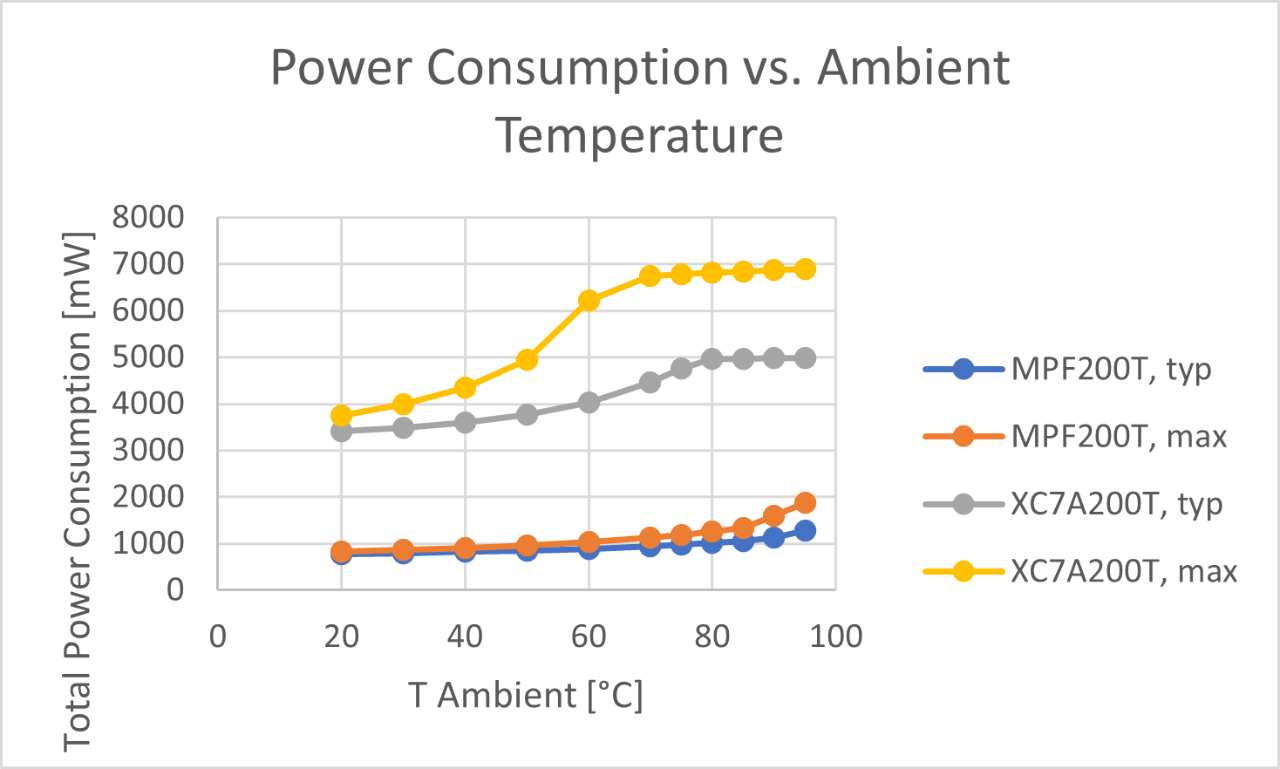
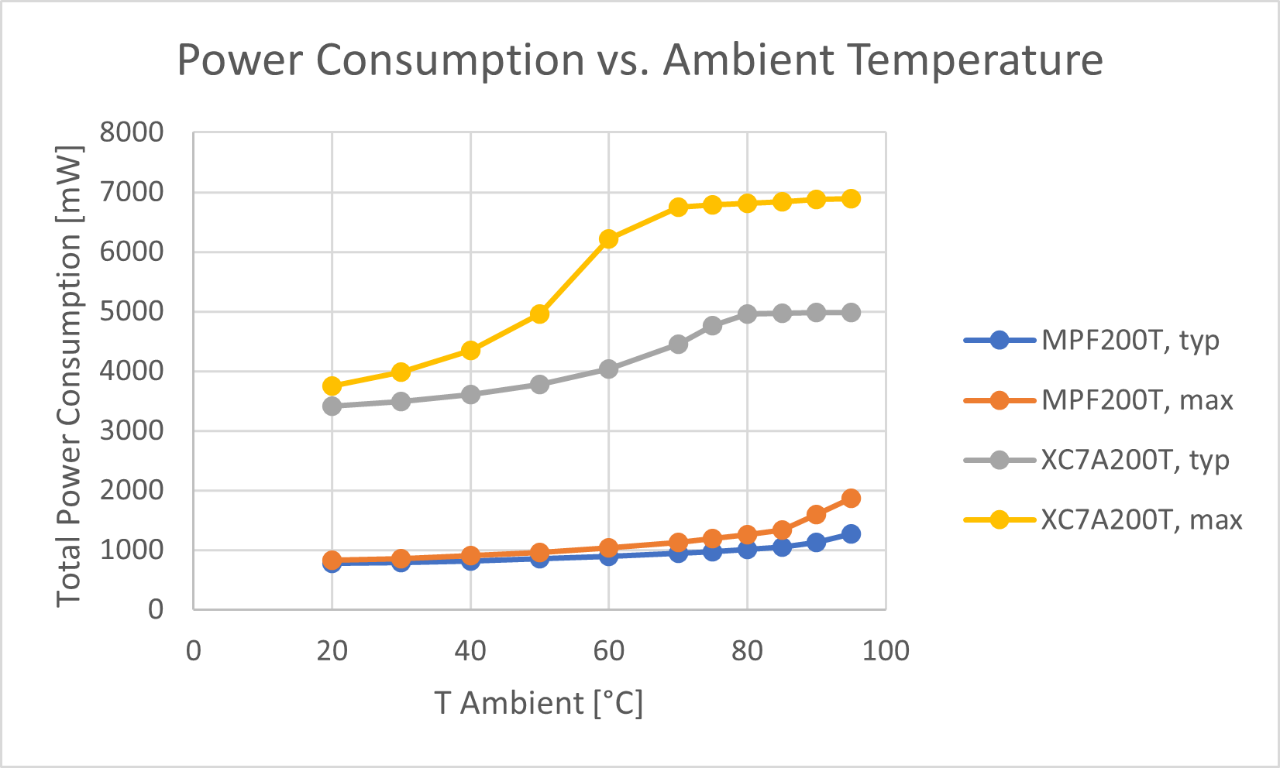
Power Consumption
The chart on the right is based on the comparison between the targeted reference design for the Xilinx AC701-board with an Artix-7 XC7A200T and a Microchip PolarFire MPF200T MPF200T FPGA. The simulation limit for the Artix-7 worst-case device becomes visible at an ambient temperature of 60°C. The PolarFire MPF200T FPGA consumes approximately one-third of the power of the Artix-7 device. For the Artix-7 device, the mentioned simulation limit is visible with the two plateaus on the curves.
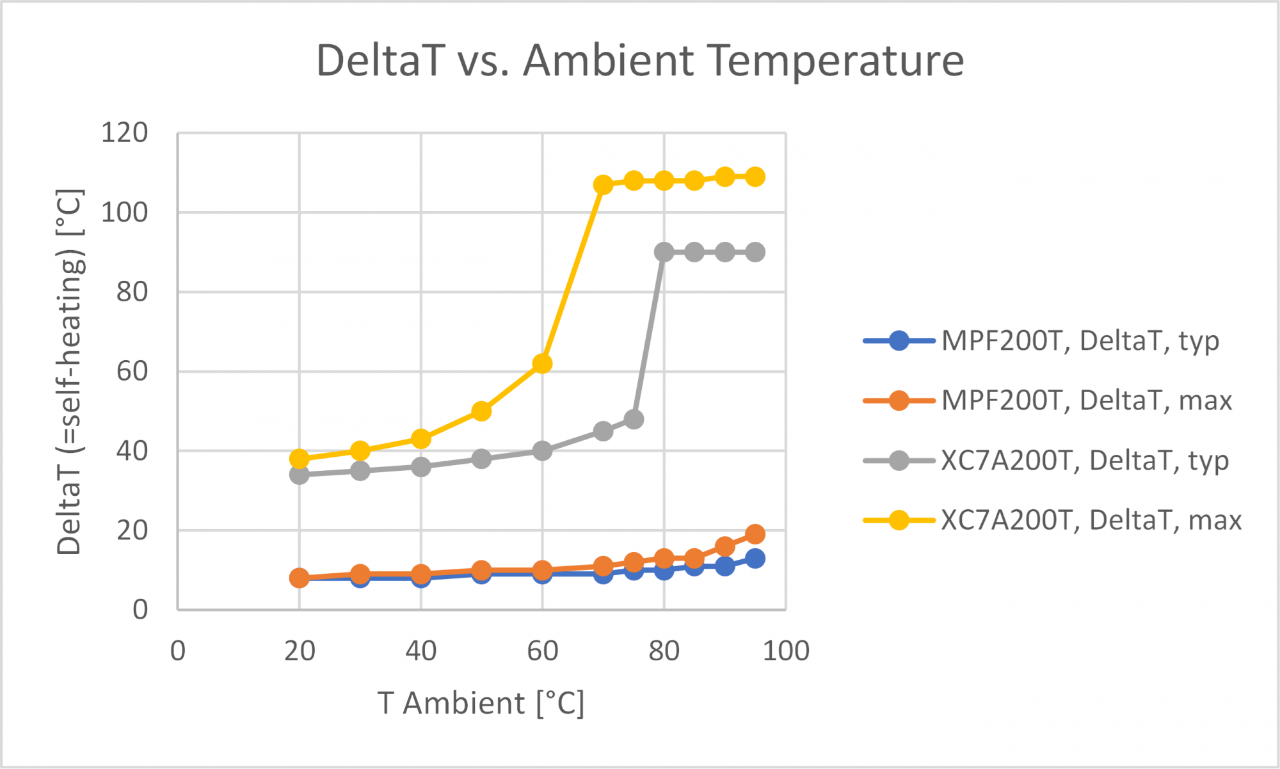
Self-Heating
The chart on the left shows the self-heating of the devices for equal settings for the cooling system in the estimation tools. The PolarFire FPGA heats up by approximately 10°C over the ambient temperature at 60°C; the Artix-7 reaches the area of thermal runaway. To stay within its operating specification the competing Artix-7 requires significantly stronger cooling that the PolarFire FPGA. For the Artix-7, the mentioned simulation limit is visible with the two plateaus on the curves.
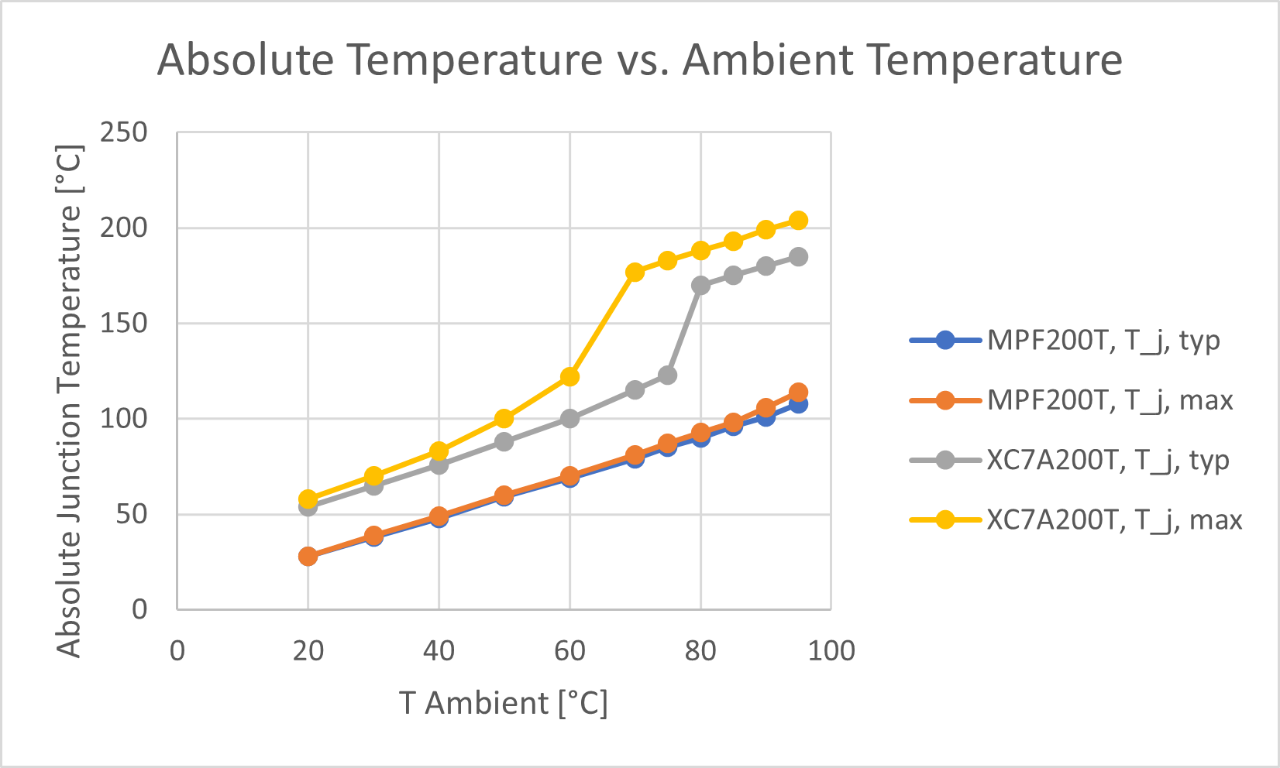
Absolute Junction Temperature
The chart for the absolute junction temperature allows a quick estimation on ambient temperatures at which the specification limits of the devices are reached. A common temperature limit is 100°C for industrial temperature grade. The Artix-7 reaches that limit at approximately 50°C ambient where the PolarFire FPGA reaches the same limit at approximately 90°C.